Five Pandas Techniques for Data Manipulations
- Kala Maya Sanyasi
- Nov 25, 2021
- 3 min read
PANDAS
Pandas is a Python library used for working with data sets. It is used for for analysing, cleaning, exploring and manipulating data. Pandas allows us to analyse big data.It can clean messy data sets, and make them readable and relevant.
Exploring Dataset
First we import the python libraries, pandas and numpy as follows.
import pandas as pd
import numpy as np
Now we load our csv (comma-separated values ) file and assign a file name to it.
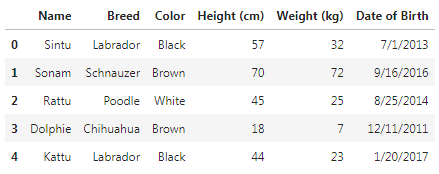
df = pd.read_csv('Rectangular Data.csv')To read the first five rows of our data we make use of head() method.
df.head()Output
We make use of tail() method along with it we assign a numeric value for the number of last rows we want to view. Here we have assign 2, in order to view the last two rows of our data.
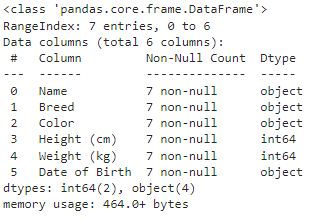
df.tail(2)The info() function is used to print a concise summary of a DataFrame. This method prints information about a DataFrame including the index dtype and column dtypes, non-null values and memory usage.
df.info()The shape attribute is used to view the number of rows and columns of our DataFrame.
df.shape

output
(7, 6)
Pandas describe() is used to view some basic statistical details like percentile, mean, std etc. of a data frame or a series of numeric values.
df.describe()

output
array([['Sintu', 'Labrador', 'Black', 57, 32, '7/1/2013'],
       ['Sonam', 'Schnauzer', 'Brown', 70, 72, '9/16/2016'],
       ['Rattu', 'Poodle', 'White', 45, 25, '8/25/2014'],
       ['Dolphie', 'Chihuahua', 'Brown', 18, 7, '12/11/2011'],
       ['Kattu', 'Labrador', 'Black', 44, 23, '1/20/2017'],
       ['Pelki', 'Chow Chow', 'Tan', 39, 25, '4/20/2015'],
       ['Zimba', 'St. Bernard', 'Grey', 55, 30, '2/27/2018']],
      dtype=object)
The columns attribute and index returns the column labels and the index name of the given Dataframe.
df.columns
output
Index(['Name', 'Breed', 'Color', 'Height (cm)', 'Weight (kg)',
       'Date of Birth'],
      dtype='object')

df.index
output
RangeIndex(start=0, stop=7, step=1)
2. Pivot Table
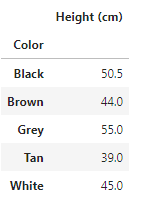
First we calculate the mean of height of each color.
df.pivot_table(values='Height (cm)', index='Color')Median of each color Height is calculated.
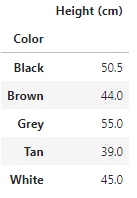
df.pivot_table(values='Height (cm)', index='Color', aggfunc=np.median)To view multiple statistics we make use of aggfunc
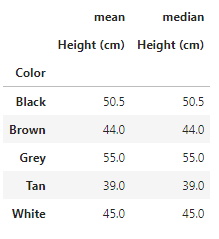
df.pivot_table(values='Height (cm)', index='Color', aggfunc=[np.mean, np.median])Pivot in Two variables.
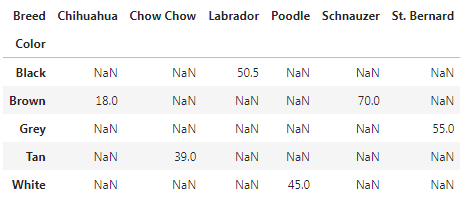
df.pivot_table(values='Height (cm)', index='Color', columns='Breed')Filling missing values, value to replace missing values with (in the resulting pivot table, after aggregation).
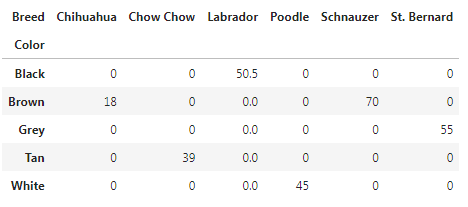
df.pivot_table(values='Height (cm)', index='Color', columns='Breed', fill_value=0)We sum the rows and columns together.
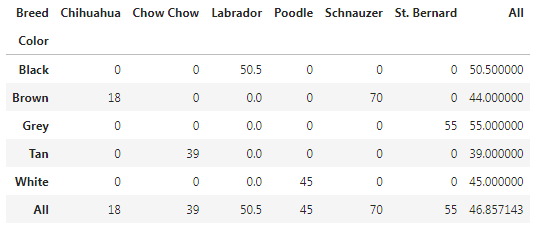
df.pivot_table(values='Height (cm)', index='Color', columns='Breed', fill_value=0, margins=True)
3. Sorting
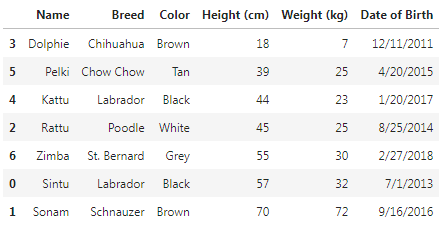
The sort_values() function sorts a data frame in Ascending or Descending order of passed Column. By default pandas sorts the datas in ascending order.
df.sort_values('Height (cm)')In order to sort the datas in descending order we have to specify ascending=False.
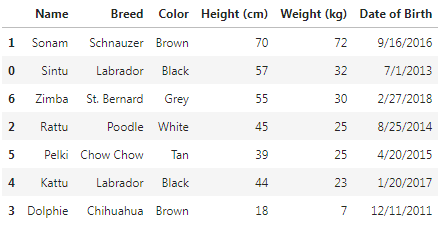
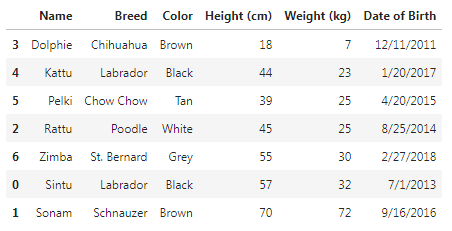
df.sort_values('Weight (kg)', ascending=False)We can also sort multiple values by calling pandas DataFrame .sort_values in ascending with a list of column names to sort the rows in the DataFrame object based on the columns specified.
df.sort_values(['Weight (kg)', 'Height (cm)'])4. Subsetting
To select a single column, use square brackets [] with the column name of the column of interest.
df['Breed']

Output
0       Labrador
1      Schnauzer
2         Poodle
3      Chihuahua
4       Labrador
5      Chow Chow
6    St. Bernard
Name: Breed, dtype: object
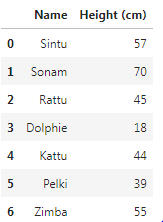
To select multiple columns we can pass the column name of the desired columns.
df[["Name","Height (cm)"]]Subsetting rows with boolean values
df["Height (cm)"] > 50

Output
0     True
1     True
2    False
3    False
4    False
5    False
6     True
Name: Height (cm), dtype: bool
Subsetting rows with numeric values
df[df["Height (cm)"] > 50]Subsetting datas based on words.
df[df["Breed"] == 'Labrador']
Subsetting with on multiple datas
is_lab = df['Breed'] == 'Labrador'
is_black = df['Color'] == 'Black'
df[is_lab & is_black]
5. Summary Statistics Summary statistics is a part of descriptive statistics that summarises and provides the gist of information about the sample data. Statisticians commonly try to describe and characterise the observations by finding: a measure of location, or central tendency, such as the arithmetic mean. We find the mean of height as follows.
df['Height (cm)'].mean()

Output
46.857142857142854
We also calculate the oldest and the latest date.
df['Date of Birth'].min()
Output
'1/20/2017'

df['Date of Birth'].max()
Output
'9/16/2016'
We calculate the cumulative sum of the weights of the dogs as follows.
df['Weight (kg)'].cumsum()

Output
0     32
1    104
2    129
3    136
4    159
5    184
6    214
Name: Weight (kg), dtype: int64
Conclusion
This article is written in part of the data insight online program with reference of datas from DataCamp.



Comments