3 Important Data Cleaning Methods in Python Data Analysis
- Ibrahim M. A. Nasser
- Dec 8, 2021
- 5 min read

Introduction
Data Analysis (DA) is the process of cleaning, transforming, and modeling data to discover useful information for critical decision-making. The purpose of Data Analysis is to extract useful insights from data and then taking the appropriate decisions based upon those insights. Data cleaning is the process of fixing or removing incorrect, or incomplete data within a dataset.
When making a dataset as a result of combining multiple data sources, there are many opportunities for data errors and inconsistencies. If there is something wrong with the data, it negatively affects the process of decision making because our analysis will be unreliable, even though they might look correct!
An important thing to mention here, is that there is NO one absolute way to prescribe the exact steps in the data cleaning process because the processes varies from dataset to other. However, it is important to create a template for your data cleaning process so you know what issues you are looking for. In this blog post we will discuss three important data cleaning processes that you have to check during your data analysis journey, which are: data type constraints, inconsistent categories, and cross-field validation. Let's dive in!
Data Type Constraints
Data can be of various types. We could be working with text data, integers, decimals, dates, zip codes, and others. Luckily, Python has specific data type objects for various data types. This makes it much easier to manipulate these various data types in Python. Before start analyzing data, we need to make sure that our variables have the correct data types, other wise we our insights of the data would be totally wrong.
With regards to data type constraints we will work with a dataset about ride sharing, the data contains information about each ride trip regarding the following features:
rideID
duration
source station ID
souce station name
destination station ID
destination station name
bike IDF
user type
user birth year
user gender
And it looks like this:

String to Numerical
The very first thing to spot as a data analyst is the duration column, as you can see, the values contains "minutes", which is not appropriate for analysis. We need this feature to be pure numerical data type, not string!
Let's Handle this!
First: remove the text "minutes" from every value
We will use the function strip from the str module
and store the new values in a new column: duration_trim
ride_sharing['duration_trim'] = ride_sharing['duration'].str.strip('minutes')Second: convert the data type to integer
We will apply the astype method on the column duration_trim
and store the new values in a new column: duration_time
ride_sharing['duration_time'] = ride_sharing['duration_trim'].astype('int')Finally: check with as assert statement
assert ride_sharing['duration_time'].dtype == 'int'If this line of code produces no output, things are fine!
Done!
We can now derive insights from this feature, like what is the average duration for the rides?
print("Average Ride Duration:")
print(str(ride_sharing['duration_time'].mean()) + ' minutes')
Numerical to Categorical
If you look at the user_type column, it looks fine, however, let's try a deeper look!
ride_sharing['user_type'].describe()
Oops! pandas is treating this as float! However, it is categorical!
The user_type column contains information on whether a user is taking a free ride and takes on the following values:
(1) for free riders.
(2) for pay per ride.
(3) for monthly subscribers.
We can fix this by changing the data type of this column to categorical and store it in a new column: user_type_cat
ride_sharing['user_type_cat'] = ride_sharing['user_type'].astype('category')Let's check with an assert statement:
assert ride_sharing['user_type_cat'].dtype == 'category'Let's double check by deriving an insight about what is the most frequent user type
ride_sharing['user_type_cat'].describe()
Great! it seems that most users are pay per ride users because the top category is 2.
Problems with data types are solved!
Inconsistent Categories
As you already know, categorical variables are where columns need to have a predefined set of values. When cleaning categorical data, some of the problems we may encounter include value inconsistency, and the presence of too many categories that could be collapsed into one
Let's say that we have a dataset that contains survey's responses about flights, information available are:
response ID
flight ID
day
airline
destination country
destination region
boarding area
departure time
waiting minutes
how clean the plan was
how safe the flight was
satisfaction level of the flight
And the it looks like this:

How to check categorical inconsistencies?
First: Create a list of all categorical variables
categorical_features = ['day', 'airline', 'destination', 'dest_region',
       'dest_size', 'boarding_area', 'cleanliness',
       'safety', 'satisfaction']
Second: Build a function to check the uniqueness
def check_unique(col):
    print('------------------------------------------------')
    print(f"Column: {col}")
    print(airlines[col].unique())
Finally: Loop over the list
for col in categorical_features:
    check_unique(col)
Capitalization
Let's start with making sure our categorical data is consistent. A common categorical data problem is having values that slightly differ because of capitalization. Not treating this could lead to misleading results when we decide to analyze our data. This problem exists in the column dest_region with regards to our dataset

To deal with this, we can either capitalize or lowercase the dest_region column. This can be done with the str.upper() or str.lower() functions.
airlines['dest_region'] = airlines['dest_region'].str.lower()
airlines['dest_region'].unique()
Notice that there is another error, "europe" and "eur" are two values belong to the same category. We can fix this by replacing all "eur" to "europe" or vice versa.
airlines['dest_region'] = airlines['dest_region'].replace({'eur':'europe'})

airlines['dest_region'].unique() 
dest_region problems have been addressed!
Spaces
Another common problem with categorical values are leading or trailing spaces. We can spot this in the dest_size attribute.

To handle this, we can use the str.strip() method which when given no input, strips all leading and trailing white spaces.
airlines['dest_size'] = airlines['dest_size'].str.strip()
Problems with inconsistent categories are solved!
Let's see our last data cleaning method.
Cross-Field Validation
Cross field validation (CFV) is the use of multiple fields in your dataset to sanity check the integrity of your data.
Let's have a look at this banking dataset:

The dataset contains information about bank accounts investments providing the following attributes:
ID
customer ID
customer birth date
customer age
account amount
investment amount
first fund amount
second fund amount
third fund amount
account open date
last transaction date
Where CFV can be applied?
We can apply CFV on two columns:
1. Age
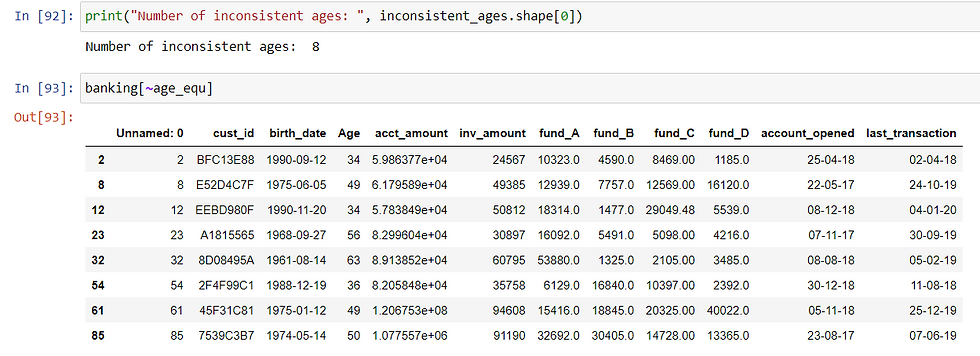
We can check the validity of the age column values by computing it manually using the birth date column and check for inconsistencies.
2. investment amount
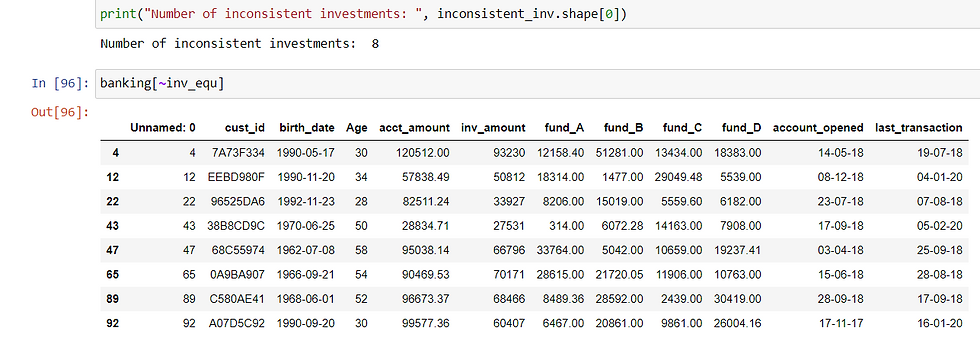
We can apply CFV to the whole amount by manually sum all of the four funds and check if they sum up to the whole.
CFV for Age
First, let's convert the datatype to datetime
banking['birth_date'] = pd.to_datetime(banking['birth_date'])Then we can compute ages
import datetime as dt
today = dt.date.today()
ages_manual = (today.year - 1) - banking['birth_date'].dt.year
Finally, find consistent and inconsistent ages
age_equ = ages_manual == banking['Age']
consistent_ages = banking[age_equ]
inconsistent_ages = banking[~age_equ]
These eight data points are inconsistent:

CFV for investment amount
First, store the partial amount columns in a list
fund_columns = ['fund_A', 'fund_B', 'fund_C', 'fund_D']And then we can find consistent and inconsistent investments
# Find rows where fund_columns row sum == inv_amount
inv_equ = banking[fund_columns].sum(axis = 1) == banking['inv_amount']

# Store consistent and inconsistent data
consistent_inv = banking[inv_equ]
inconsistent_inv = banking[~inv_equ]
These data points are inconsistent when it comes to cross field validation for the whole investment amount:

What to do with those 16 inconsistent data points?
There is NO one size fits all solution, the best solution requires an in-depth understanding of the dataset. We can decide to either
Drop inconsistent data
Deal with inconsistent data as missing and impute them
Apply some rules due to domain knowledge
Conclusion!
And here you are reaching the end of this blog post!
In this blog, we discussed three important data cleaning methods. We learned how to diagnose dirty data, and how to clean it. We talked about common problems such as fixing incorrect data types, and problems affecting categorical data. We have also discussed more advanced data cleaning processed, such as cross field validation.
Thank you for reading this! And don't forget to apply what you learned in your daily data tasks!
Best Regards, and happy learning!
Note:
You can find the source code and the datasets in my GitHub.
Acknowledgment
This blog is part of the Data Scientist Program by Data Insight.

Comments