
Unsupervised Learning: Basics of Clustering
- Abu Bin Fahd
- Aug 5, 2022
- 2 min read

What is unsupervised learning?
A group of machine learning algorithms that find patterns in data
Data for algorithms has not label, classified or characterized
The objective of the algorithm is to interpret any structure in the data
Common unsupervised learning algorithms: clustering, neural networks, anomaly detection
What is clustering?
The process of grouping items with similar characteristics
Items in groups similar to each other than in other groups
Example: distance between points on a 2D plane
Plotting data for clustering - Pokemon sightings
from matplotlib import pyplot as plt
x_coordinates = [80, 93, 86, 98, 86, 9, 15, 3, 10, 20, 44,
                                56, 49, 62, 44]
y_coordinates = [87, 96, 95, 92, 92, 57, 49, 47, 59, 55, 25,
                                2, 10, 24, 10]
plt.scatter(x_coordinates, y_coordinates)
plt.show()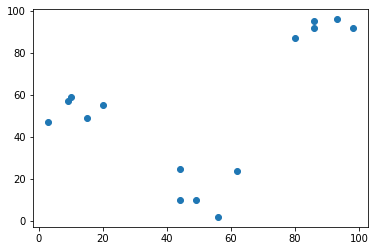
Data are separated into three parts!!!
Basic of cluster analysis
What is a cluster?
Group of items with similar characteristics
Google News: articles where similar words and word associations appear together
Customer Segments
Clustering algorithms
Hierarchical clustering
K means clustering
Other clustering algorithms: DBSCAN, Gaussian Methods
Hierarchical clustering in SciPy
from scipy.cluster.hierarchy import linkage, fcluster
from matplotlib import pyplot as plt
import seaborn as sns, pandas as pd

x_coordinates = [80.1, 93.1, 86.6, 98.5, 86.4, 9.5, 15.2,
    3.4, 10.4, 20.3, 44.2, 56.8, 49.2, 62.5, 44.0]
y_coordinates = [87.2, 96.1, 95.6, 92.4, 92.4, 57.7, 49.4,
     47.3, 59.1, 55.5, 25.6, 2.1, 10.9, 24.1, 10.3]

df = pd.DataFrame({'x_coordinate': x_coordinates,
        'y_coordinate': y_coordinates})

Z = linkage(df, 'ward') # ward: based on the sum of squares
df['cluster_labels'] = fcluster(Z, 3, criterion='maxclust')

sns.scatterplot(x='x_coordinate', y='y_coordinate', hue='cluster_labels', data = df)
plt.show()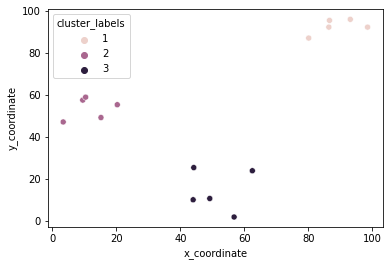
K-means clustering in SciPy
from scipy.cluster.vq import kmeans, vq
from matplotlib import pyplot as plt
import seaborn as sns, pandas as pd
import random
random.seed((1000,2000))

x_coordinates = [80.1, 93.1, 86.6, 98.5, 86.4, 9.5, 15.2,
    3.4, 10.4, 20.3, 44.2, 56.8, 49.2, 62.5, 44.0]
y_coordinates = [87.2, 96.1, 95.6, 92.4, 92.4, 57.7, 49.4,
    47.3, 59.1, 55.5, 25.6, 2.1, 10.9, 24.1, 10.3]

df = pd.DataFrame({'x_coordinate': x_coordinates,
      'y_coordinate': y_coordinates})

centroids,_ = kmeans(df, 3)
df['cluster_labels'], _ = vq(df, centroids) # centroid: based on the geometric mean of all objects

sns.scatterplot(x='x_coordinate', y='y_coordinate',
      hue='cluster_labels', data = df)
plt.show()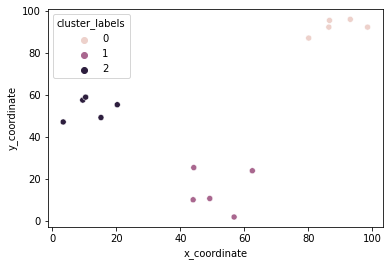
Data preparation for cluster analysis
Why do we need to prepare data for clustering?
Variables have incomparable units (product dimensions in cm, price in $)
Variables with the same units have vastly different scales and variances (expenditures oncereals, travel)
Data in raw form may lead to bias in clustering
Clusters may be heavily dependent on one variable
Solution: normalization of individual variables
Normalization of data
Normalization: the process of rescaling data to a standard deviation of 1
from scipy.cluster.vq import whiten
data = [5, 1, 3, 3, 2, 3, 3, 8, 1, 2, 2, 3, 5]
scaled_data = whiten(data)
print(scaled_data)
[2.72733941 0.54546788 1.63640365 1.63640365 1.09093577 1.63640365
1.63640365 4.36374306 0.54546788 1.09093577 1.09093577 1.63640365
2.72733941]# Import plotting library
from matplotlib import pyplot as plt
# Initialize original, scaled data
plt.plot(data,label="original")
plt.plot(scaled_data,label="scaled")# Show legend and display
plot
plt.legend()
plt.show()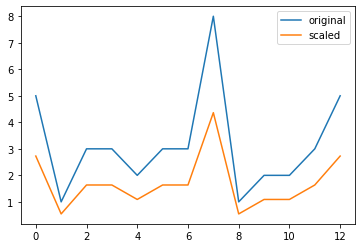
Comments